
Getting an edge on the bookies is key for punters in maximising their profits, and so hopefully the first publication of our Expected Results spreadsheet last week helped you to bash them good and proper at the weekend.
If you missed out then fear not, as have updated the sheets for the Championship down to the National League in order to help you make more informed betting decisions this weekend. Bookmark and enjoy!
Premier League
There’s no spreadsheet for the Premier League as yet as we are happy to investigate in more detail as to whether the Expected Result ratio is in proportion or not.
Thus far it seems to be, with the division’s big boys doing the business when well backed by the market. Both Manchester sides triumphed with consummate ease, while the likes of Chelsea and Spurs were made to fight slightly harder but still prevailed as the bookmakers’ favourites.
Leicester and Arsenal fought out a draw, which was predicted if the movement of the line in the hours before kick-off was anything to go by, while West Ham celebrated the first game in their new Olympic Stadium home by beating Bournemouth.
There were a few unexpected results however, as we might expect at this early stage of the season. Everton were actually underdogs with the bookmakers for their trip to the Hawthorns to take on West Brom, but intuitively we know that they have the weapons to beat the Baggies and so it proved. Victories for Hull and Middlesbrough at Swansea and Sunderland were unpredicted largely, but the big shock of the weekend came at Turf Moor where Burnley saw off Liverpool 2-0. Yes, this was an unexpected result, but we’d wager that this won’t be the first fat cat tamed at the Clarets’ home this term.
The Championship
Up until now the Championship had been the most predictable division in the upper echelons of English football, so did that theme continue this weekend?
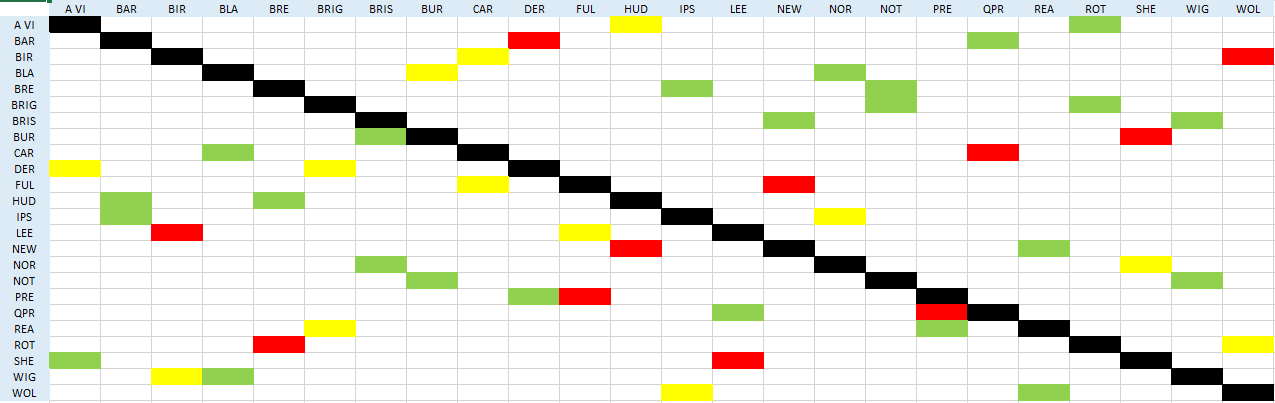
- Expected Results – 50%
- Unexpected Results – 23%
- Draws – 27%
The Expected Result figure is down from 58% to 50%, and this is largely due to a number of draws – five in all – disrupting the status quo. As far as Unexpected Results go, however, the Championship is still registering a shock in less than a quarter of fixtures – good news for punters.
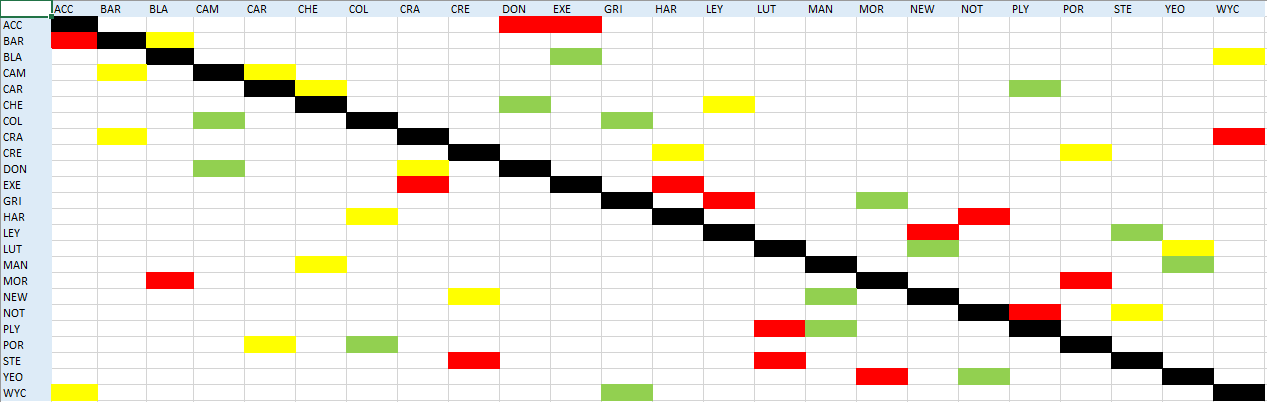
League One
Until now League One has witnessed the most draws in percentage terms of overall fixtures, so has that trend continued this weekend?

- Expected Results – 44%
- Unexpected Results – 27%
- Draws – 29%
The Expected Result ratio has increased after a more straightforward weekend in League One, with the draw count failing considerably to the kind of level we would expect. Unexpected Results emerge from roughly one in four games in the division.
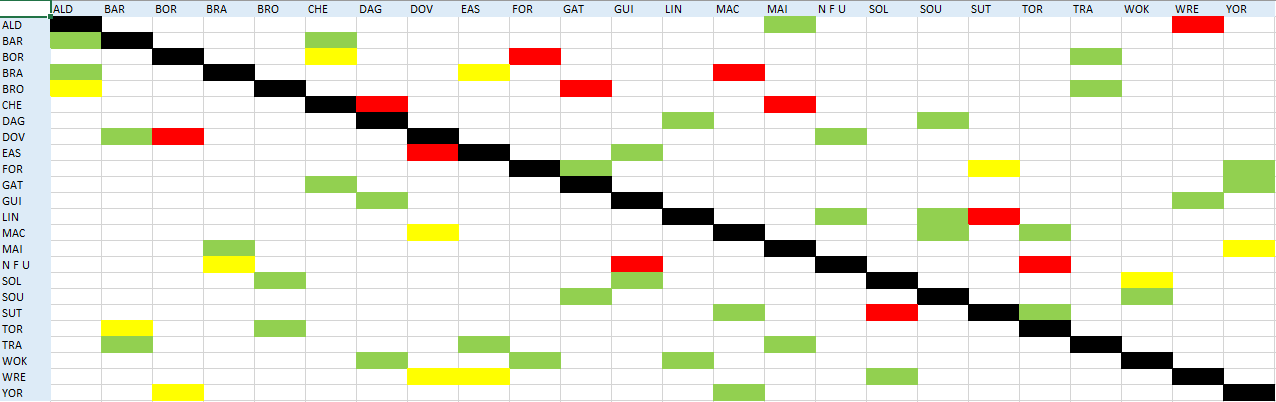
League Two
League Two’s reputation for betting unpredictability precedes it, so with another action-packed gameweek gone has the balance been redressed any?
- Expected Results – 31%
- Unexpected Results – 33%
- Draws – 36%
The answer is yes, sort of. Expected Results have increased by 25% and draws decreased by 2% also. The Unexpected Outcome count remains unsavourily high at one in every three games, which should put punters on red alert when putting their betslips together.
National League
A bastion of betting hope amongst a desolate wasteland of unpredictability, the National League has delivered an Expected Result count of 56% up until this weekend. Has that pattern continued?
- Expected Results – 62%
- Unexpected Results – 19%
- Draws – 19%
For punters who enjoy a sure bet, as or as near as damn it, then the National League is your best port of call. Nearly two in every three matches in the division end as the bookmakers have predicted; helping you to place your wagers more effectively.
In Conclusion
The idea behind these spreadsheets is two-fold: presenting punters with an idea of which of English football’s top divisions is the most profitable in terms of betting predictability, but also perhaps acting as a think-piece on why teams in one division are more likely to produce shock results than another.
The first part of that puzzle is well under way; if you want to increase your chances of betting success, have a flutter on the National League. As the data set grows, perhaps that trend will continue, perhaps it won’t – only time will tell.
As for identifying where the quality gap is greatest….that’s still a work in progress.