 The year is hurtling along at relentless pace and the English Premier League campaign, which is now eight rounds of matches old, heads into its second international break.
As such, now is as good a time as any to press the pause button and reflect on the season so far.
They say that the league table doesn’t lie, but actually after eight rounds of fixtures it just might. Why? Because some teams may have enjoyed a happy set of games where they have taken on considerably weaker opposition.
So, some sides towards the summit of the table may have had an ‘easy’ run, while others at the wrong end may just have had a tough schedule to contend with.
There are many different ways to analyse eight rounds of matches, and our view is that simply looking at the league table isn’t enough to gain a deep understanding of what is happening.
From a betting perspective, that’s important. We can learn plenty from exploring the league by looking at basic stats, and enhance our education by implementing a few other techniques as well.
So, this is our review of the Premier League so far, and lessons that the average punter may just have missed.
Premier League ELO Ratings

For those unfamiliar with ELO ratings, in short it’s a system where we can analyse the strength of a particular team by seeing how they perform against ‘better’ and ‘weaker’ teams.
The upshot is that sides that regularly get good results against teams who, according to standard measures, are better then them, may just be worth backing in the long term.
Also, we can identify ‘flat track bullies’, i.e. those teams who always get the job done against weaker opposition.
To learn more about the ELO system you should read about its forefather, Arpad Elo, on Wikipedia, and how points are awarded based on team strength. It’s a tad too complex to reproduce here!
But how does the ELO ratings system help us? Well, after eight rounds of Premier League matches, we can consider theoretical rankings based on fixture difficulty so far. This, arguably, is a more accurate picture than the actual league table.
A great blog, Since A Win, produce ELO ratings each week for the Premier League, and you see more of their great work here.
You might be thinking ‘what the heck am I looking at?’. Well, this is a look at how a theoretical Premier League table would look based on ELO points, which takes into consideration strength of opposition played.
So, you can see Tottenham only gained one point by beating a weaker Cardiff outfit on Saturday, yet Bournemouth got +24 for winning away from home at the comparable Watford.
What do the ELO ratings tell us? The big six are still in pride of place at the top of the pile, while Fulham, Cardiff and Huddersfield look in big trouble at the wrong end of the table.
If you are a convert to the ELO system, there are some bets that will catch your eye. West Ham to finish in the top half, at 5/2, could be a decent price if the Hammers can keep key players fit, while Watford to finish in the bottom half at 10/11 will attract interest.
And Fulham to be relegated at 9/4 certainly has legs given that they also sit just two points above the dropzone in the *actual* league table.
Premier League Expected Goals & Points
 Expected Goals, or xG as it is commonly displayed, is enjoying increasing popularity with Match of the Day, Sky Sports and other mainstream football mainstays.
We have taken the basic data and produced our own model: The Premier League Expected Points table.
Before we leap in, here’s a basic guide to Expected Goals. Basically, each chance in a football match is given a score based on its likelihood of resulting in a goal. So, a nice easy tap in gets a high score, while a speculative long shot less so.
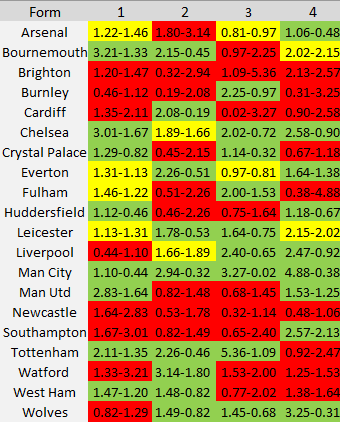
At the end, the scores can be published in a simple way. For example, the Liverpool vs Manchester City game on Sunday ended 0.44-1.10 as far as xG is concerned, as shown in the from table.
We take that data and produce a league table based on it. So, if you win the xG count you get three points, and zero for a loss. If the difference is 0-0.25 between the teams, it’s a draw and one point is awarded to each side.
The concept is that the league table below reflects the quality of chances that all of the Premier League teams have created thus far. On the left is the overall table, plus there’s home and away tables too. The coloured section on the right is the most recent xG scores for each time.

So what do we learn?
Again, it reiterates that Fulham to be relegated and Watford to finish in the bottom half are both sound bets, and there is still value in taking them on in the outright markets.
Oh, and it looks like Pep Guardiola’s men will be cruising to the league title once more!
